High Demand for Older Cars in the US: Study Reveals
American consumers are increasingly turning to older cars, driven by the high cost of newer models.
The market share of cars 10-years-old or older has increased by 30 percent since 2014.
Older sedans, wagons, and hatchbacks are leading the drive in old-car sales.
A new study has found that the used-vehicle market share held by cars that are at least a decade old has increased by 30 percent since 2014. This trend is attributed to the high prices of new and nearly new cars, making older cars a more affordable option for many buyers.
According to the study conducted by ISeeCars, the average price of an older car has increased by more than 60 percent from 2014 to 2024. While inflation accounts for some of this increase, it does not explain the full extent. The study also reveals that sedans, wagons, and hatchbacks are the most commonly purchased older cars, as they are more affordable to fuel and insure compared to trucks and SUVs.
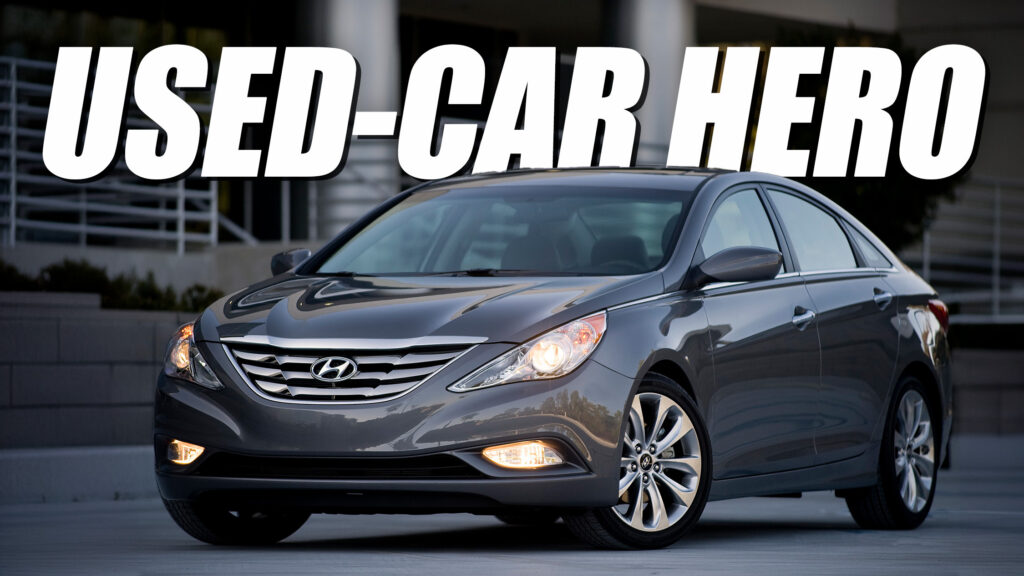
Notable models that have seen a significant increase in market share among older cars include the Hyundai Sonata, Subaru Legacy and Impreza, Mercedes C-Class and E-Class, and BMW 3-Series. The Hyundai Sonata, in particular, has experienced a 484 percent jump in market share between 2014 and 2024.
The study also analyzed the demand for older cars across different regions in the US. Seattle-Tacoma has the highest market share of older cars at 23.2 percent, compared to the national average of 17.2 percent. In contrast, San Antonio has a much lower market share of older cars at 7.7 percent.
Market share of cars 10-years-old or older
| Rank | Model | Market Share of Cars 10 Years or Older, 2014 | Market Share of Cars 10 Years or Older, 2024 | % Change in Market Share, 2014 to 2024 | Average Price of Cars 10 Years or Older, 2014 | Average Price of Cars 10 Years or Older, 2024 | % Change in Price, 2014 to 2024 |
|---|---|---|---|---|---|---|---|
| 1 | Hyundai Sonata | 4.8% | 28.0% | 484.3% | $4,867 | $8,312 | 70.8% |
| 2 | Subaru Legacy | 6.6% | 27.4% | 316.8% | $5,556 | $8,871 | 59.7% |
| 3 | Subaru Impreza | 10.6% | 43.9% | 313.5% | $9,809 | $12,203 | 24.4% |
| 4 | Mercedes-Benz C-Class | 9.1% | 28.6% | 215.0% | $7,419 | $10,139 | 36.7% |
| 5 | Subaru Impreza (wagon) | 12.1% | 35.9% | 195.7% | $6,871 | $10,797 | 57.2% |
| 6 | Mercedes-Benz E-Class | 15.1% | 41.0% | 172.0% | $8,529 | $12,096 | 41.8% |
| 7 | Hyundai Elantra | 7.7% | 20.6% | 166.7% | $4,462 | $8,241 | 84.7% |
| 8 | BMW 3 Series | 12.6% | 30.2% | 139.0% | $7,305 | $10,180 | 39.3% |
| 9 | Nissan Altima | 8.6% | 20.5% | 137.0% | $5,432 | $8,023 | 47.7% |
| 10 | Honda Odyssey | 18.2% | 39.3% | 115.9% | $5,987 | $10,496 | 75.3% |

